Description
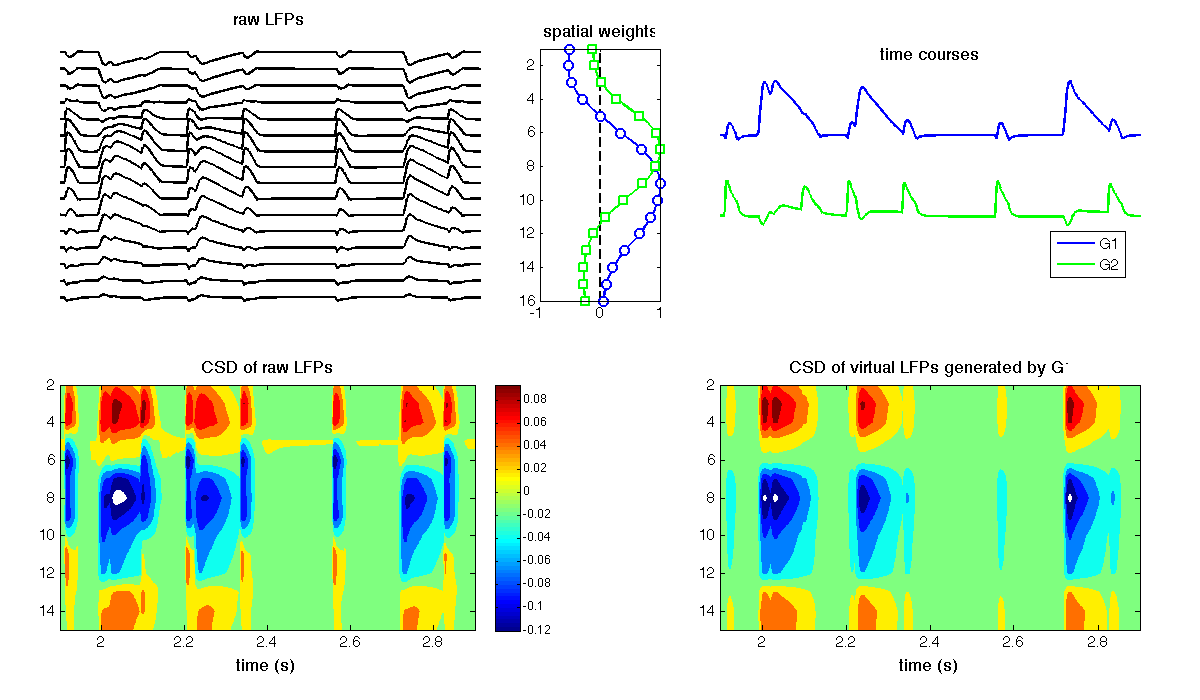
This script corresponds to several subplots shown in Fig. 4 (Spatial and temporal cross-contamination between LFP-generators with a strongly unbalanced contribution) of the manuscript:
Makarova et al. (2011). Parallel Readout of Pathway-Specific Inputs to Laminated Brain Structures. Frontiers in Systems Neuroscience.
Reviewer #3 request: evaluation of the code
August 22, 2011.
close all
clear all
dum = load('./DATA/e8_6HzA15.txt')';
LFP = dum(2:end,:);
Fs = 1/(dum(1,2)-dum(1,1));
id1 = round(1.9*Fs); id2 = round(2.9*Fs);
figure('color','w','position',[100 100 1200 700])
subplot('position',[0.05 0.55 0.35 0.4])
for k = 1:size(LFP,1),
    plot((id1:id2)/Fs,LFP(k,id1:id2) - 0.5*(k-1),'k','LineWidth',2)
    hold on
end
axis([[id1, id2]/Fs,-size(LFP,1)*0.5,0.5])
axis off
title('raw LFPs','FontSize',14)
[~,~,D] = princomp(LFP');
N=find(cumsum(D)/sum(D)>0.99,1);
[weights,sphere,compvars,bias,signs,lrates,v] = runica(LFP,'verbose','off','pca',N,'maxsteps',1500);
M=pinv(weights*sphere);
M(:,2)=-M(:,2); v(2,:)=-v(2,:);
[nE, nG] = size(M);
alpha = max(M);
for k = 1:nG,
    M(:,k)=M(:,k)/alpha(k);
    v(k,:)=alpha(k)*v(k,:);
end
s=std(v,[],2);
[~,idx]=sort(s,'descend');
M=M(:,idx);
v=v(idx,:);
subplot('position',[0.45 0.57 0.1 0.36])
xx=1:0.25:nE;
clr='bgrcmyk';
smb='osv*+x';
plot([0 0],[1 nE],'k--','LineWidth',2)
hold on
for k = 1:nG,
    plot(spline(1:nE,M(:,k),xx),xx,[clr(k) '-'],'LineWidth',2)
    plot(M(:,k),1:nE,[clr(k) smb(k)],'LineWidth',2,'MarkerSize',8,'MarkerFaceColor','w')
end
set(gca,'YDir','reverse')
axis([-1 1 1 nE])
set(gca,'FontSize',12)
title('spatial weights','FontSize',14)
subplot('position',[0.6 0.6 0.35 0.3])
for k = 1:nG,
    plot((id1:id2)/Fs,v(k,id1:id2)-(k-1),clr(k),'LineWidth',2)
    hold on
end
title('time courses','FontSize',14)
axis([[id1,id2]/Fs,-nG,1])
axis off
legend({'G1','G2'},'location','best','FontSize',12)
subplot('position',[0.05 0.1 0.4 0.35])
CSD = diff(LFP(:,id1:id2),2);
cL = linspace(-0.12,0.12,10);
contourf((id1:id2)/Fs,2:nE-1,CSD,cL,'LineColor','none')
set(gca,'YDir','reverse')
set(gca,'FontSize',12)
colorbar
xlabel('time (s)','FontSize',14)
title('CSD of raw LFPs','FontSize',14)
subplot('position',[0.6 0.1 0.35 0.35])
LFP_G1=M(:,1)*v(1,:);
CSD_G1=diff(LFP_G1(:,id1:id2),2);
contourf((id1:id2)/Fs, 2:nE-1,CSD_G1,cL,'LineColor','none')
set(gca,'YDir','reverse')
set(gca,'FontSize',12)
xlabel('time (s)','FontSize',14)
title('CSD of virtual LFPs generated by G1','FontSize',14)